It’s common to hear that the world has become safer. Likewise, a common criticism of those who disagree is that they are ignorant of the facts. According to some measures, we have seen decades or even centuries of improvement in the form or lower violence, with instances of war or homicides per capita often presented as relevant factors.
Let’s look at how this relates to studying systems and unintended consequences.
From a talk by Steven Pinker on the topic:
“Homicide rates plunge whenever anarchy and the code of vendetta are replaced by the rule of law. It happened when feudal Europe was brought under the control of centralized kingdoms… It happened again in colonial New England, in the American Wild West when the sheriffs moved to town, and in Mexico….
“Indeed, we’ve become safer in just about every way. Over the last century, we’ve become 96 percent less likely to be killed in a car crash… 89 percent less likely to be killed by an act of God, such as a drought, flood, wildfire, storm, volcano, landslide, earthquake or meteor strike, presumably not because God has become less angry with us but because of improvements in the resilience of our infrastructure….
“Why don’t people appreciate progress? Part of the answer comes from our cognitive psychology… The easier it is to recall something from memory, the more probable we judge it to be.”
How might this view of the safety question lead us astray? What does it even mean to claim that the world has been getting safer (or better)? And how do systems and second-order effects relate to this question?
I’m writing about this topic today as a demonstration of how people make decisions using bad data, mistake which metrics are important, ignore unequal distribution, and misunderstand connectedness.
Bad Data
One of the common charts you might see is something like this.
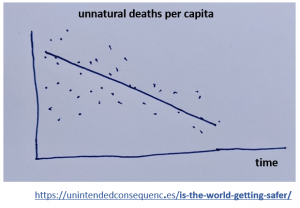
Homicide rate per capita over time. If you look at the trend line, it is downward sloping, which on this chart is a measure of improvement. But is this a good measure of reality?
There are a few problems with this type of assessment. First there is the question of whether the data is good. Data from past centuries is difficult to assess for accuracy. Much of it is related to war. In some cases, both aggressors and victims may intentionally inflate the death count. Aggressors inflated the amount of death and destruction they created to project power and fear.
For the victims, it was sometimes a way to rally around a common cause: to rise up against an enemy. How much can we trust this past data?
Another question is what we choose to include and not include. Data can be cherry-picked and data can also just not be available. Were past examples of low violence simply not recorded as much? Or were more extreme events more likely to be recorded?
Mistaken Metrics
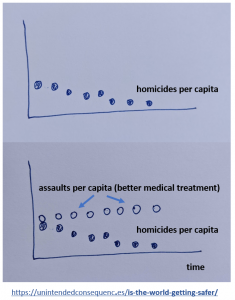
Then there is the way we measure safety. Simple measurements of this often just look at the homicide rate per capita. But things change dramatically if you factor in medical improvements and instead look at assault, injury, or casualty rates instead.
Our world, with dramatic medical improvements, will seem safer simply because more people can be saved. From “Murder and Medicine: The Lethality of Criminal Assault 1960-1999:”
“[W]e think the best starting point in explaining the homicide paradox [that homicides are declining] involves the observation of parallel, dramatic developments in medical technology and related support services, developments that may have functionally, and equally dramatically, suppressed the homicide rate compared to what it would be had such progress not been made. If so, this success has ironically masked the perception that America continues to face extraordinarily high levels of criminal violence. Compared to 1960, the year our analysis begins, we estimate that without these developments in medical technology there would have been between 45,000 and 70,000 homicides annually the past 5 years instead of an actual 15,000 to 20,000.”
This claim turns the chart at the top into the chart at the bottom.
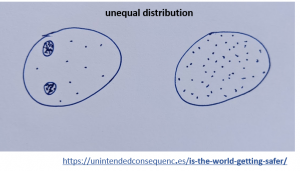
Unequal Distribution
Another way to reassess the safety question is to ask whether safety is equally distributed or not? Here are two examples of the world with the same amount of danger but with differences and how the danger is distributed.
We also see undesirable safety when populations become “safer,” for example by entering a security lockdown, but where the safety is not in the interest of the people affected. An extreme version of this is what I wrote about in Uyghurs in Xinjiang – Onward to the Inevitable.
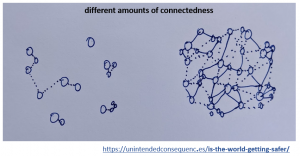
Connectedness
Writing on this site, I’m especially interested in interconnections and systems. Another way that the safety argument falls short is that the world today is much more connected than it was in the past. Even if there has been an improvement in safety, there is greater potential for that to change in a big way.
In the past, you might see relatively isolated pockets of the world with very different results from elsewhere but with limits on how those problems could be exported. With fewer connections problems moved more slowly than today.
If you include the spread of disease as a factor of safety, you might come to the conclusion that the world of a couple hundred years ago was safer simply because it was more difficult to spread a dangerous disease to many people quickly. I’ve written about the spread of disease often this year and before. The fast global spread of COVID is another example of just how fast situations can change.
The speed of that change should give you pause in simply saying that the world has gotten safer. If an unheard of disease can quickly travel around the world today, that potential is latent danger. And that danger should factor into any models of safety.
Beyond disease, the development of interconnected systems or more powerful weapons leaves other questions. Technological advances can happen hast. WWI and WWII saw weaponry that would have seemed impossible a couple generations earlier. That latent capability, or the potential to quickly deploy that weaponry broadly is another question.
Pinker’s assessment of why we don’t generally appreciate improvements is also telling.
“News is about stuff that happens, not stuff that doesn’t happen. You never see a journalist who says, “I’m reporting live from a country that has been at peace for 40 years,” or a city that has not been attacked by terrorists. Also, bad things can happen quickly, but good things aren’t built in a day.”
What about that last sentence? The fact that bad things can happen more quickly than good things is the point.
Projections
Finally, it’s misleading to simply take the first chart and extend the trendline forward. Even if we take there to be no change in interconnectedness, recovery rates, or data accuracy, how do we project forward? We can’t simply just draw a straight line from where we are today. A better assessment would consider the above points and try to model potential outcomes.
Consider
- I don’t see a benefit to drawing conclusions for the wrong reasons. But yes, I do want the world to be safer.
- Bad data was also a reason we heard a lot about food shortages in the early days of COVID in the US.
- Connectedness is a tough one to appreciate. As I wrote mid-2019 in Systems for Spreading: “Slowing the availability to quick international travel would disrupt huge populations and economies. Small numbers can infect large populations. That means that it is likely that we’ll eventually see other mass mortalities like the Spanish Flu.”